


As part of my SQL learning journey, I did another challenge from the series #8WeekSQLchallenge by Danny Ma. It's something about pizza, you'll see.
The database for this challenge consisted of 6 tables.
I created them from scratch following the schema SQL code provided on Danny's website to familiarize myself with the table creation process. The code is available on my GitHub.
customer_orders - which shows each order's order_id, customer_id, pizza_id, exclusions, extras and order_time. It has 1 row for every individual pizza that is part of the order. The pizza_id relates to the type of pizza which was ordered whilst the exclusions are the ingredient_id values which should be removed from the pizza and the extras are the ingredient_id values which need to be added to the pizza. Note that customers can order multiple pizzas in a single order with varying pizza id, exclusions and extras values even if the pizza is the same type!
runner_orders - shows each runner's order_id, runner_id, pickup_time, distance, duration and cancellation
pizza_names - names of the pizzas offered. This joint only offers two.
pizza_recipes - Each pizza_id has a standard set of toppings which are used as part of the pizza recipe.
pizza_toppings - This table contains all of the topping_name values with their corresponding topping_id value
runners - shows the registration_date for each new runner
Introduction
Existing data
pizza_runner database schema - be sure to include this reference within your SQL scripts as you start exploring the data and answering the case study questions.You can find every detail about this project's entity relationship diagram, data, table descriptions and further instructions on Danny's website. Check them out to understand what I was working with.
Data cleaning
I examined the data and realized it was faulty. I had to work on it before working on it. No data is ready until it's cleaned right? I got my hands dirty on this. It was not a lot of data but it had some null values.
Cleaning customer_orders table

The missing exclusions and extras values are not null, I replaced them with actual null values. NULL means the customer did not specify inclusions or extras so they're not actual missing values.

Cleaning the runner_orders table

Cleaning steps:
Changed the blanks in cancellation into actual
NULLvalues. It means the order was not cancelled.Removed the non-numeric characters from the duration field.
Removed non-numeric characters and spaces from the distance field so that it would be seamless during calculations.
Changed
pickup_timedata type fromVARCHARtoTIMESTAMPChanged the 'null' values in any of the columns into actual
NULLs

All the other tables were neat. Now let's cook.
Case Study questions
This case study had questions divided into:
Pizza Metrics
Runner and Customer Experience
Ingredient Optimisation
Pricing and Ratings
I chose to do as many as I could.
Pizza metrics
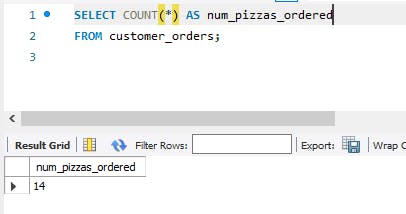
How many pizzas were ordered?
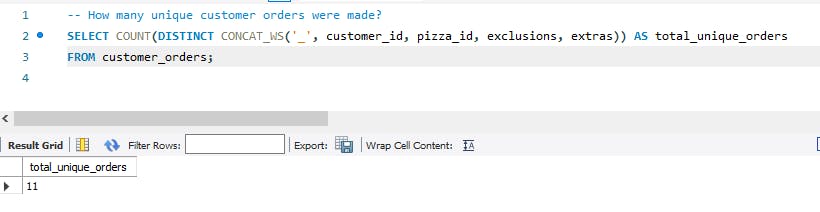
How many unique customer orders were made?
A repeat customer who has an exact order as before will have a different order_id which means we cannot use that column in our distinct clause. While doing this question, I was faced with a challenge and from it I learned about this function, CONCAT_WS I have it explained on my Twitter.
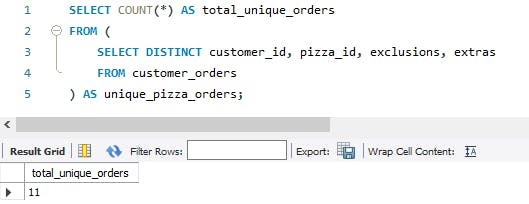
The simpler query for achieving this was
How many successful orders were delivered by each runner?
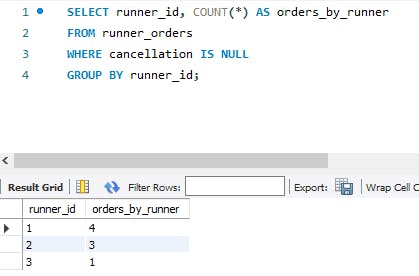
Conclusion: Runner with runner_id 1 did the most delivers while 3 did the least
How many of each type of pizza was delivered?
My knowledge of joins was put to the test here.
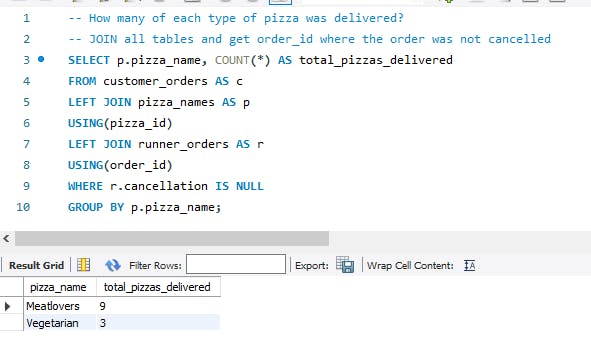
Conclusion: Meatlovers pizza is the most ordered.
How many Vegetarian and Meatlovers were ordered by each customer?

What was the maximum number of pizzas delivered in a single order?
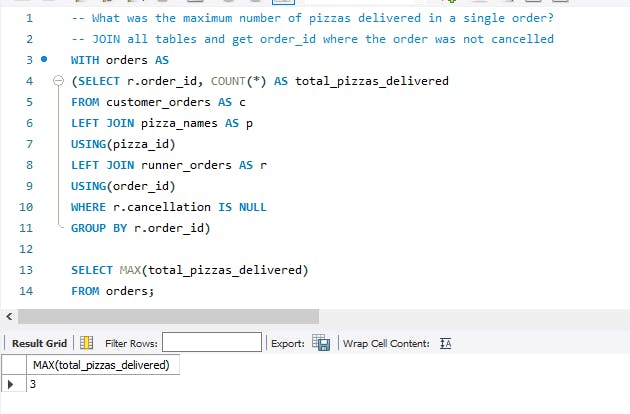
Conclusion: The most number of pizzas delivered in a single order is 3
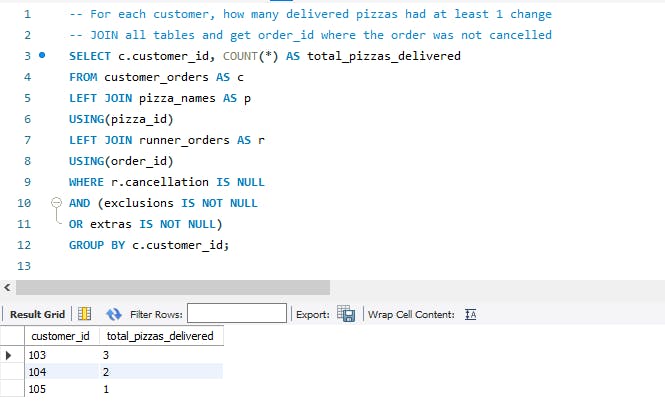
For each customer, how many delivered pizzas had at least 1 change and how many had no changes?
Focus was on whether or not exclusions or extras were specified.
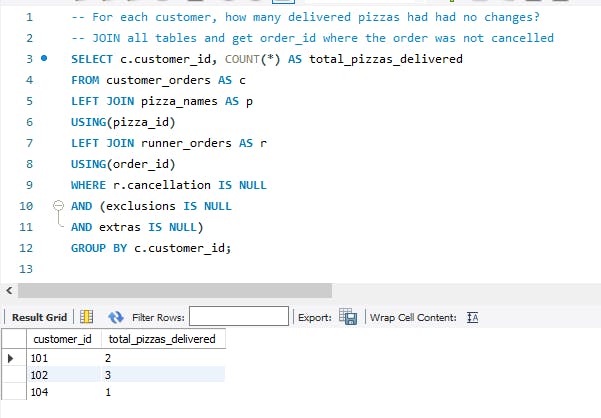
How many delivered pizzas had no changes?
In this case, we are focussing on orders in which no exclusions and extras were specified
How many pizzas were delivered that had both exclusions and extras?
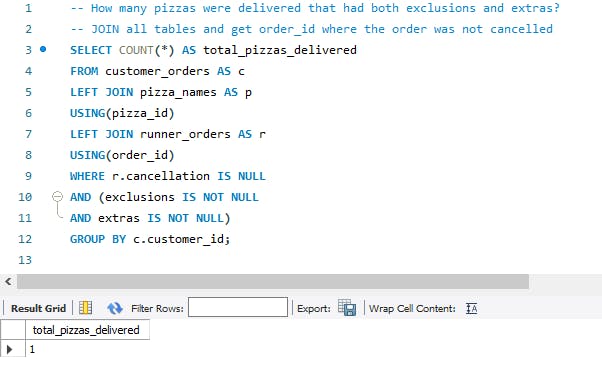
Conclusion: Only 1 pizza was delivered that had both exclusions and extras.
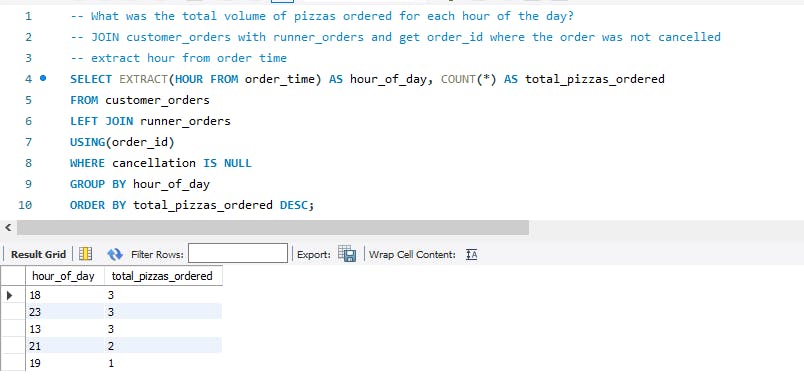
What was the total volume of pizzas ordered for each hour of the day?
What was the volume of orders for each day of the week?

Runner and Customer Experience
How many runners signed up for each 1 week? (i.e. week starts 2021-01-01)
I extracted the week from the registration date and then passed 1 as an argument to specify that the week starts on Monday.

What was the average time in minutes it took for each runner to arrive at the Pizza Runner HQ to pick up the order?
I extracted minutes from the time difference between the time the order was made and the time the rider picked it up and got the average.

Conclusion: the average time is 18 minutes
Is there any relationship between the number of pizzas and how long the order takes to prepare?
I got the average of the difference between pick-up time and order time assuming it is the time taken to prepare the order. Then counted the number of pizzas ordered in one order as they have the same Order ID.
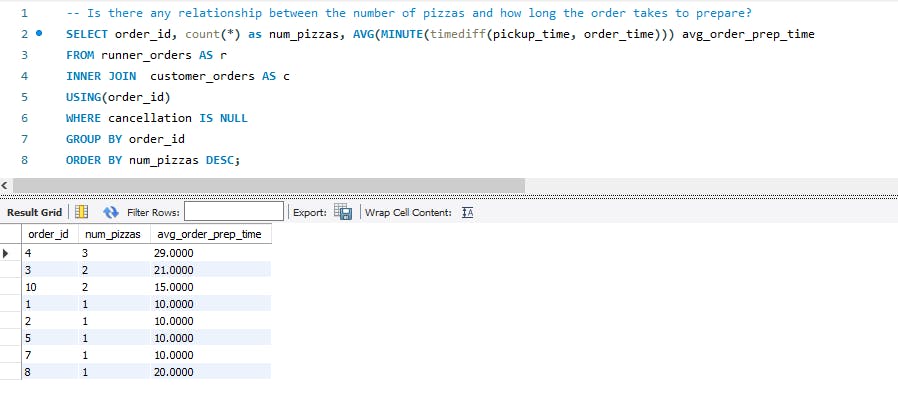
Conclusion: There seems to be a downward trend in average order preparation time as the number of orders decreases
What was the average distance travelled for each customer?
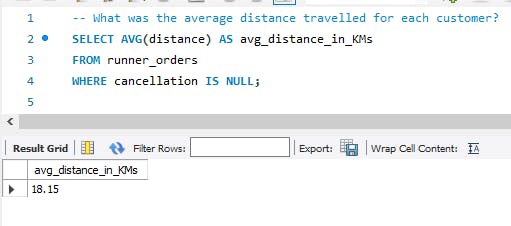
Conclusion: the average distance a runner covers is 18.15 km for each customer
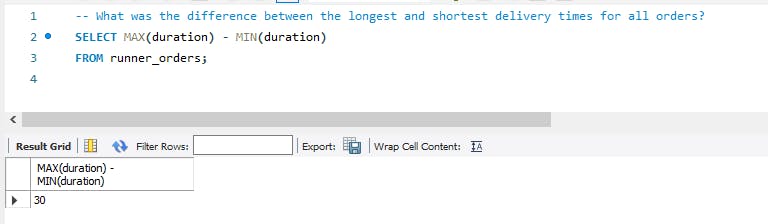
What was the difference between the longest and shortest delivery times for all orders?
What was the average speed for each runner for each delivery and do you notice any trend for these values?
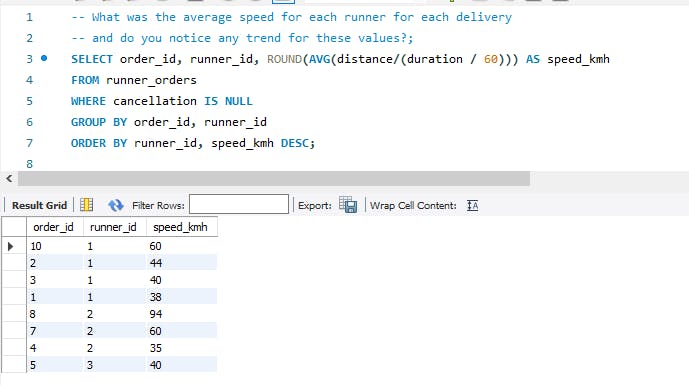
Conclusion: No defined trend
Ingredients Optimization
This tested my string manipulation knowledge to the core.
What are the standard ingredients for each pizza?

Generate an order item for each record in the customers_orders table in the format of one of the following:
Meat Lovers
Meat Lovers - Exclude Beef
Meat Lovers - Extra Bacon
Meat Lovers - Exclude Cheese, Bacon - Extra Mushroom, Peppers
I did a lot of research and back and forth with chat gpt for this, but I finally got it right
