My first data analytics with excel project
Bike sales data analysis using Excel

I just extensively learnt data analysis with Excel and I decided to practice and showcase what I can do with the skills I have learnt by doing this project.
Data source
I used European countries' Bike sales data from Kaggle to perform this analysis. It has 113,037 rows of data and 18 columns: Date, Day, Month, Year, Customer_Age, Age_Group, Customer_Gender, Country State Product_Category, Sub_Category, Product, Order_Quantity, Unit_Cost, Unit_Price, Profit, Cost and Revenue.
Objectives
To figure out which country generates the most revenue
To figure out which age group our ads should target
To figure out which state is the highest contributor to the revenue in each country
To determine the most popular bike size and colour for each bike sub-category
To determine the most popular bike sub-category
To determine which gender generates the most sales revenue
To find out the highest revenue-generating product category
To find out the highest profit-generating product sub-category
To figure out the sales curves through the years
To find out the profit margins for different products
Data preparation
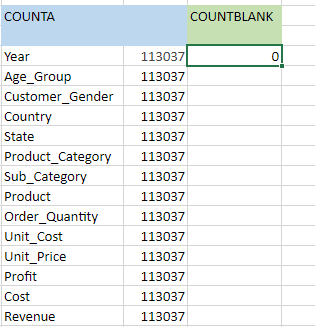
First, I deleted unnecessary columns like day and date which were irrelevant to my objectives. I had options to choose from, COUNTA, COUNTBLANK function or Find and Replace, I went with COUNTBLANK to check the entire sheet for blank cells and formatted some columns into currency.
I also replaced F and M with Female and Male respectively.

I also separated the Product descriptions for the bikes into separate columns using the text-to-columns wizard to get additional columns bike size and bike colour.

Data analysis
I analyzed data using some functions and pivot tables and used charts to represent the findings.
To find out which country generates the most revenue
Option 1:
I used the UNIQUE() function to get the countries and SUMIF() function to get the total revenue for each country. I used an absolute reference for the range and sum range and a relative reference for the Criteria cell. I used drag and drop to copy the formula through the other cells. Then sorted by revenue.

Option 2:
Pivot table

The United States generates the highest revenue while Canada generates the least.

To figure out which state is the highest contributor to the revenue in each country
I used a pivot table with filter and sort options to get the data. Filter -> Value filter -> top 10 then changed 10 to 1.

Sorted in descending order by the sum of revenue

This shows the top state in revenue generation per country and which state is the best among other states.

To find out which age group our ads should target

Conclusion: Adults aged between 35-64 are the highest contributors to the revenue.

To determine which gender generates the most sales revenue

Conclusion: Male customers buy slightly more compared to female customers

To find out the highest revenue-generating product category
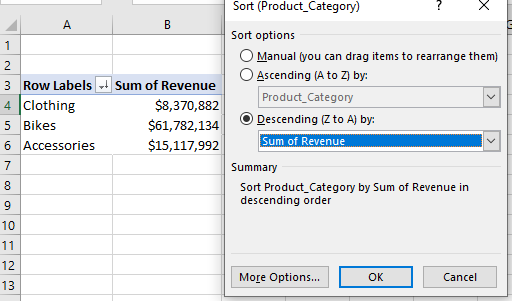
Conclusion: Bikes are the highest contributors to revenue generation.

To find out the highest profit-generating product sub-category


Conclusion: Road bikes generate the most profits followed by Mountain bikes. Caps generate the least profits.
To determine the change in revenue generation through the years

Conclusion: It is evident that the sales hike towards the end of the year.

Find out the most popular bike subcategory
Conclusion: Road bikes are more popular than mountain bikes


To determine the most popular bike size and colour for each category
Mountain bikes

Conclusion: The most popular size is 38 and the most popular color is silver.

Road bikes
I sorted it in descending order of road bike size by revenue.

Conclusion: The most popular road bike size is 48 and the least popular is 60. The most popular road bike colour is red.

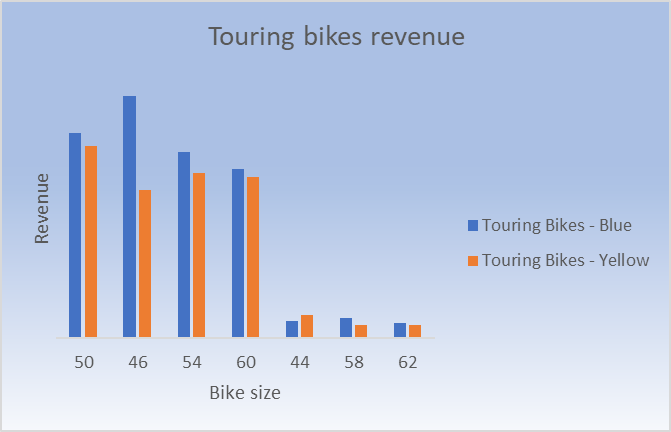
Touring bikes

Conclusion: Bike size 50 is the most popular and colour blue is the most popular
To find out the average profit margins for all products


Visualization
I added a slicer for the leftmost chart making it interactive. This can be used to filter the sales for different years.
Visualization board for all products.

Visualization board for bike types


